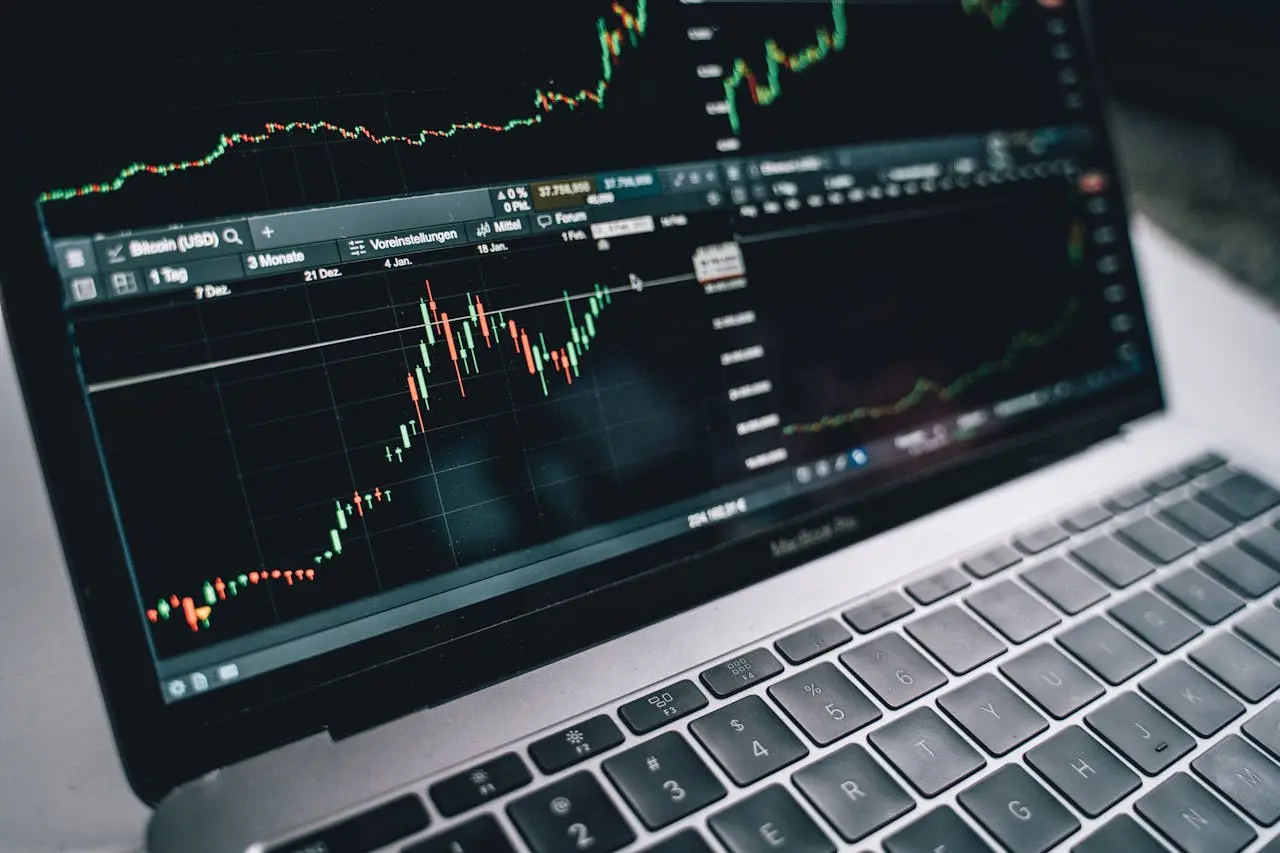
Dhan TradingView Chart: TradingView is an online platform that provides you access to study different charts such as stock market indices, Indian or global stocks, ETFs, etc. One such offering on the platform is the Nifty 50 chart through which you can analyze the price trend and place an order on the chart itself. In this article, we’ll understand how you can analyze the Nifty 50 trends on dhan tradingview.
How to Analyze Nifty 50 using the Dhan TradingView Chart?
The Nifty 50 is the market index that tracks the performance of the top 50 stocks traded on the NSE (National Stock Exchange). By analyzing the Nifty 50 index, you can trade in its related instruments, such as ETFs, futures, and options. Let’s understand how you can analyze the Nifty 50 index on the TradingView chart.
- Analyze the Chart
You can study the Nifty chart for any time frame, such as today, 5 days, 1 month, 5 years, and all time. You can check out the key data points for any time, which include open, high, low, and closing prices. You can also choose from different types of charts, such as lines, bars, candles, and areas.
- Use Technical Indicators
You can study the technical indicators for the Nifty 50 on a real-time basis, such as moving averages, oscillators, and pivots. You can see a meter for buy, sell, and neutral views for different timeframes and indicators. This helps you analyze the recommendations so you can make an informed decision.
Suppose for any timeframe, moving averages If the current price of the index is greater than the MA value, then you can take a buy position. If the opposite happens, then you can take a sell position.
- Study Nifty 50 Stocks
TradingView not only helps you analyze the Nifty 50 index but also provides an analytical view of all the Nifty 50 stocks. You can study the past performance, valuation metrics, dividends, income statement, balance sheet, and cash flow of Nifty 50 stocks. Some of the popular stocks of this index are HDFC Bank, Reliance Industries, Infosys, etc.
Access TradingView on Dhan
If you wish to access TradingView without any cost, you can open an account with Dhan. You can access the Dhan TradingView charting features by visiting the website “tv.dhan.co” and logging on to the Dhan with TradingView. You can place the order using the Dhan account after analyzing stocks, futures, and options on TradingView.
There is no need to visit multiple websites, and you can access the TradingView platform from your Dhan account completely free of charge. All you need to do is open a Dhan account, and you can connect your Dhan account with TradingView.
Conclusion
TradingView combined with the Dhan account can help you analyze the Nifty 50 trends, and you can place the order on the chart with a click. You can study any time frame chart and analyze the technical indicators to take a suitable position. You can also find the financial performance and technical indicators for each Nifty 50 stock.
